Email Newsletter (E-Newsletter)

Email has two general areas of engagement: subscription rates and engagement:

Increased Subscriptions

One measure of success of the IMC plan will be an increase in the number of subscribers to PH’s E-newsletter. More E-newsletter subscribers will show an overall increase in general awareness, interest, and support of PH’s mission.

Email Engagement Metrics

Tracking basic email metrics will reveal how your audience is responding to E-newsletters and specific content like individual messages from girl scholars, program updates, or issue-oriented statistics. Your email/newsletter software will offer various tracking options of the following data:

Open Rate: The number of people who open the E-newsletter. Open rates measure the effectiveness of your subject line.

  • Conversion Rate: The percentage of recipients who completed a call to action in the E-newsletter like a donate or share opportunity.
  • Unsubscribe Rate: The number of individuals who unsubscribe from your list.
  • Bounce Rate: The percentage of total emails sent that could not be delivered.

Resources

http://www.nten.org/blog/2009/04/16/5-key-metrics-to-improve-your-email-campaigns

http://www.idealware.org/articles/email_metrics.php

Search Engine Traffic

Google Analytics has a reporting section that helps you understand the role search engine traffic plays in coming to your site. Here are some of the most basic, yet important metrics to pay attention to while you’re getting going! This information will be found under the “Traffic Sources” tab in your Google Analytics.

Traffic Contributions and Sources  (How are people getting to your website?)

Direct navigation (User specifically typed in your website, used a bookmark, or followed a link from an email that was not sent as a promotional campaign/used a direct link.)

Referral traffic (User clicked on a link from elsewhere on the web, social media, or an email that was part of a promotional campaign.)

Search traffic (User searched in a search engine and found the website.)

Keeping an eye on these numbers and percentages will allow you to analyze where your strengths and weaknesses lie. For example, once you launch an email blast campaign, if your referral numbers consistently increase; there is a good chance your campaign is working.

Visits to Your Website Referred by Specific Search Engine Terms and Phrases

Monitoring the keywords and phrases the users are searching to get to your site is important. This information provides a foundation for words and phrases that you can use more frequently in the text of your website. Search engines search the text for these words and phrases when a user enters them into a search-engine search box.

Track the keywords and phrases and look for patterns such as seasonality or in combination with a particular event or person. For example, after CNN featured Ana Dodson on the “Heroes Special”, I imagined search phrases like the following increased substantially:

“Ana Dodson CNN”, “Peruvian Hearts CNN”, “Ana Dodson CNN Heroes”

If you know that phrases like the above are searched for around the time of features or events, you can optimize the text on your website by adding more phrases that can be searched for and found by search engines.

Conversion Rate by Search Query

This is the percentage of users who searched a specific word or phrase, then visited your website and then became a donor. This is the process of acquiring and website visitor and converting them into a donor/buyer.

Keywords and phrases are listed in order of ranking, so ideally you would rank highest for the words and phrases that have the highest conversion percentage. This can help narrow your SEO focus.

Additionally, analytics tools allow you to see which specific page on your website these users landed on when they clicked the link. You can use this information to improve the user experience on specific, high-traffic pages.
Instagram

Consider these general evaluation tips for Instagram (compiled from postplanner.com):

  • Monitor how many likes each post gets. Keep track of the type of posts generating greater likes, and post more of that kind.
  • Watch for comments. Photos getting comments mean that the follower took extra time to write a message about the photo. These kinds of posts should be featured more often.
  • Keep track of how many followers you have. The number should be steadily increasing. Measure monthly or quarterly along with Facebook and keep track of these numbers in a spreadsheet or chart.
  • To determine what percentage of followers engage with your post, divide the number of likes and comments by your follower count. For example, the last PH post (six weeks ago…that is way too infrequent) about Flor and her mother and sister received 8 likes (there are 9 but one of the likes is from Peruvian Hearts). Peruvian Hearts has 71 followers. 8 divided by 71 is 0.11, which means that the engagement percentage for that post is 11%.
  • Measure whether or not followers are clicking on your link in your profile account by using a customized URL to track clicks.
  • Search hashtags to find out if followers are talking about you.
  • Measure which photos are performing best. Iconosquare is a tool that enables you to keep track of that information: http://iconosquare.com/

Facebook

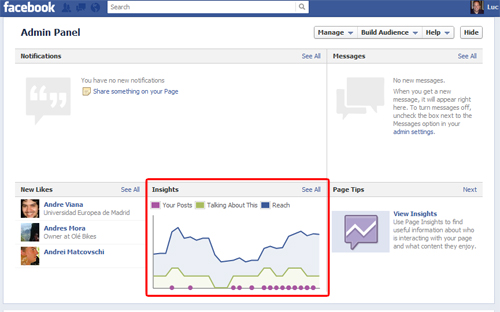
You can monitor what messages are reaching people on Facebook through measuring likes and comments on posts. Facebook makes it easy for you to determine which messages are resonating with fans through their “insights” section on the homepage of your Facebook account.


Facebook_Insights_AdminPanel02

With insights you can:

  • Monitor what’s working and not working on your page
  • Understand the people who like your page and engage in your posts
  • Make decisions about the best ways to connect with your audience

When you click on the insight page, you will see a breakdown of how many people like your page, the percentage of people your posts are reaching, and a measurement of engagement.

Keeping track of the data supplied on the insights page on a quarterly (or monthly if you want more frequent updates) allows you to identify which types of messages are resonating with your audience, and allows you to make informed decisions about what content to post.

Insights also provide a graph to show you when your fans are active online. This information is beneficial because it allows you to determine when the best time to make a post is.

There are many social media measurement templates available online either to use or to replicate. This template by Rachel Melia at rachelimelia.com is a good example of how to keep track of your data and measure your interactions.

(https://rachelmelia.files.wordpress.com/2011/02/sm-reporting-template1.gif)

Facebook stats

General Social Media

You can track what an individual/sub-set of social media posts contribute to website traffic and eventually donations. You can add “campaign parameters” to a URL that tells Google Analytics that helps uniquely identify a piece of content for tracking purposes. In Google Analytics you can filter by these parameters to see their contribution. You’ll want to figure out a naming convention that makes sense to you.

Google’s URL Builder

https://support.google.com/analytics/answer/1033867?hl=en

Best Practice: Add a campaign parameter to any URL you post on social media (or give another website to link to your site).

You can also get alerts through Google Analytics to measure social media interactions. This is useful when running a campaign that has a start and end date. To do this, you sign into Google Analytics and heard into alerts. Set-up an alert for significant increases in day-to-day traffic for Facebook and you will get email updates when traffic becomes heavier.

Setting Up Alerts in Google Analytics
  • Log into your Google Analytics account; Select the account/website you wish to set an alert for.
  • Click the Settings button in the upper-right corner.
  • Under Profiles, click Assets > Custom Alerts > Create an Alert.
  • Under Alert Name, enter something that will be easy to recognize when you receive the email.
  • The Period will depend on how long your promotion is running. For short promotions, a day works well.
  • Under This Applies To, select Traffic Sources > Source, and under Conditions select Contains Twitter. This will send you alerts about the traffic you’re receiving from Twitter. You can play with these options to receive different alerts about different outlets such as YouTube, Pinterest or Facebook.
  • Under Alert Me When, select Visits and under Condition select a number that makes sense for you. If you’re looking for spikes in traffic, you will want to put Previous Day as the Compared To value. For this one, I chose 50% more traffic than the previous day. (socialmediaexaminer.com)

Back to Evaluation Plan

General Website Traffic

Google Analytics is installed on your website and will help you understand the behavior of the users on your site. Here are some goal-oriented steps to consider as you use your Google Analytics tools. These ideas come from http://www.bruceclay.com/analytics/google-analytics.htm

STEP ONE: Determine Needs

Determine what your website visitor’s needs are going to be. Once you understand what their needs are, you can figure out a way to meet them. Here are some examples of visitor needs:

  • To find out more about Peruvian Hearts
  • To find out how to donate
  • To donate
  • To find out what other organizations have partnered with Peruvian Hearts
  • To find out who Ana Dodson is and learn more about her story

The Peruvian Hearts website is primarily a content site so some of its objectives are to increase readership- level of interest and time spent on the site (stickiness). Basic measures include visit length, and page views, and number of newsletter subscriptions and cancellations. The site also has some E-commerce characteristics because it connects to a donation site.

STEP TWO: Identify Goals

The macro goals for your site will be the broad main ones. For example:

  • Generate awareness about Peruvian Hearts
  • Create personal connections with visitors and donors

The micro goals for your site will be the relationship building activities that lead to the macro goals. For example:

  • Increase the number of newsletter subscriptions
  • Increase the amount of time spent on the site by each user
  • Increase the number of newsletters that get subscribed to
  • Increase the number of pages viewed by each user
  • Increase the number of news articles read by each user
  • Increase the number of web links clicked by each user
  • Increase the number of videos viewed by each user
  • Increase the number of clicks to donate at the ColoradoGives site

You may want to measure these activities to see if you are reaching your goals. When you have an activity in mind that you would like to measure, you should first ask yourself: “If we can get more visitors to complete this activity, will our site become more successful?” If the answer is yes, then go ahead and measure.

STEP THREE: Define Metrics

You’ll need to define the metrics that indicate progress on the goals you set in step two. For example, you could start to measure visit length and page views for each page. You can measure conversion and completion rates to see if you have met your micro goals.

STEP FOUR: Collect Data

Because you have setup page tagging by using the JavaScript code on each of your web pages, data is automatically being collected. To do this step effectively based on the goals metrics defined in steps two and three, you might need to add to your Google Analytics configuration. This is referred to as custom tracking. You can find more about this in Google Analytics documentation.

STEP FIVE: Record Data

You’ll need to record the data and compare it over time to see if your statistics are improving based upon your specific goals.

STEP SIX: Test Improvement Strategies

Once you have monitored your data, you can formulate and implement better strategies for accomplishing the same activities.

STEP SEVEN: Implement Improvements

You’ll want to implement improvements by changing your site and then testing the changes.

STEP EIGHT: Measure Results

Measure your return on investment, and start the process over again. Look at your progress towards your goals and make revisions as you see fit. Your reached goals are your new baselines, there is always more to achieve, so continue to set the bar higher.

Back to Evaluation Plan

Develop an in-bound marketing framework using search and social

Steps to Implement

  • Identify opportunities for back links. Backlinks help Google determine page authority. Reach out to receptive organizations/bloggers that refer to Ana and PH and request they link to PH as part of their article.
  • PH can create simple webpage badges that donors can post on their blogs or other websites to express their support. This also creates a backlink for SEO purposes.
  • A similar effect can be achieved in social by inviting donors who have just completed a donation to share their support on social media.
  • PH can use free and easy-to-use marketing automation tools like IFTTT.com to automatically push social media posts to other platforms. This saves time and helps unify the overall communication strategy. Give each social media platform a unique page/role as to where they point to the website or to other social media. Automation tools can then be used to solidify these approaches. This makes connecting social traffic to donor conversions easier.

Invite Email Traffic to Visit the Website/Donate

Steps to Implement

  • Email newsletters/communication should leverage the same approach when including calls-to-action in messaging as website content (consistent colors, language).
  • Email messaging efforts should be evaluated on their effectiveness of driving traffic to the website and drive additional donations. Dimensions to evaluate might include:
    • Article teaser or full-text included in email communication
    • Use of images, headline tests, and sidebar content
    • Frequency of communication
    • Degree of personalization

Define a conversion funnel and accompanying analytics dashboard strategy

Services like Google analytics allow you to identify custom events that help track whether users accomplish key site activities like clicking a call-to-action, filling out a form, or sharing a piece of content to social media. These might include

  • Return visit (visit number)
  • Form view/ Form Submit (%)
  • Call-to-action success rate

Similarly, Google analytics can be configured to track inbound traffic to help you determine which source (i.e. from Facebook compared to from Search) is more likely to donate on the first visit, second visit, etc. These types of attributes might include

  • Geo-location
  • Referrals (email, social, search, paid, partners)

Steps to Implement

  • Identify a list of key site activities that should be tracked, and rank them from most valuable to least valuable and in the order a user will likely do them (for example they might share to social media before they donate). This becomes the first draft of your conversion funnel.
  • Create a dashboard to track user’s progress through these checkpoints.

Introduce a lead generation form to the website

Many website users are ready to act and will respond to calls-to-action on the site to donate and volunteer; others are almost ready, but would be interested in additional information. Lead forms are a way for users to volunteer their interest/intent in donating by requesting more information. It allows for a more focused follow-up and conversation.

Steps to Implement

  • Create a page from within WordPress to put the form on
  • You can find many easy to use WordPress plug-ins that will make form building easier
  • Create a form with fields such as: name, email, phone number (optional), and the ability to select what type of information they might be interested in. They can volunteer their physical address if they would like next steps to be mailed to them (i.e. pledge card)
  • Form submissions should be sent to an inbox that is actively monitored. Ideally, responses are given within 24-36 hours.